Overview
In order to make financial data more accessible to business users, a new Excel on HANA tool is being implemented. This tool allows users to drag and drop fields directly into an Excel pivot table. The tool uses the SFA Simplified Dataset as its data source. Like the SFA Simplified Dataset and other Boiler Insight stars, the data is updated nightly.
Pre-requisites & System set up
In order for users to have access to the tool, they must follow the steps below.
- If the user has never used Excel Pivot Tables, they must take an online course to familiarize themselves with the tool. See LinkedIn Learning for Excel Pivot Table training opportunities.
- Ensure the software has been pushed to your machine. Data related questions contact FP&A at TreasReporting@purdue.edu and software questions contact BICC@purdue.edu.
- Refer to the SFA/XL Connection Guide to set up your initial connection.
Data Concepts
The tool uses the SFA Simplified Dataset as its source. In general, you will see some new terms added to field names. Below is information that may help in understanding how these terms are used.
Posting – This indicates where the actual posting in SAP/S4 occurred. More commonly, in fiscal years prior to 2019, these could be different from the Reporting fields. This term is used with Funded Program and Cost Center Hierarchy.
Reporting – This term refers to who owns the master data element, not necessarily where the posting happened in SAP/S4. This term is used with Parent Funded Program and Cost Center Hierarchy.
Trend – This field indicates that logic has been added to postings prior to fiscal year 2019 to help align postings with the new master data elements implemented in 2019 for trend purposes.
A best practice would be to stay consistent with these fields within your view, i.e. if you are using Reporting fields, always use reporting fields, don’t combine Reporting with Posting. Or, if you are looking at multiple years, use Trend fields consistently.
Hierarchical Fields
Some fields are available in both a hierarchical field and also as a stand-alone field. You should be aware of which you are choosing, as they act differently within the pivot table and filters.
Hierarchical
Commitment Item – contains all levels from Category 0 to Commitment Item.
Cost Center Posting—contains all levels from Company to Cost Center from a Posting point of view
Cost Center Reporting - contains all levels from Company to Cost Center from a Reporting point of view
Stand Alone
Campus Display – Posting
Campus Display – Reporting
Segment – Posting
Segment - Reporting
Business Area Display Posting
Business Area Display – Reporting
Financial Unit Display – Posting
Financial Unit Display – Reporting
Financial Sub Unit Display – Posting
Financial Sib Unit Display – Reporting
Program Display – Posting
Program Display - Reporting
Cost Center Display – Posting
Cost Center Display – Reporting
Category 0
Category 1
Category 2
Category 3
Category 4
Commitment Item Display
Cautions
General/Tool
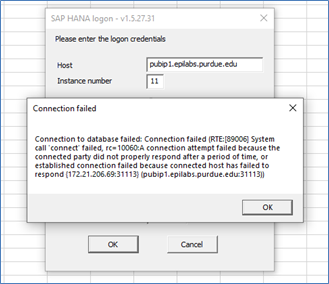
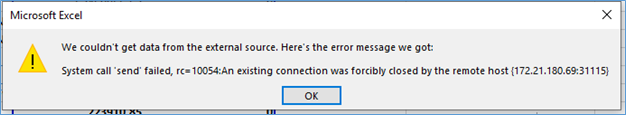
- You MUST be logged onto VPN. If you are not, you will get the error message shown below.
Calculating Balances
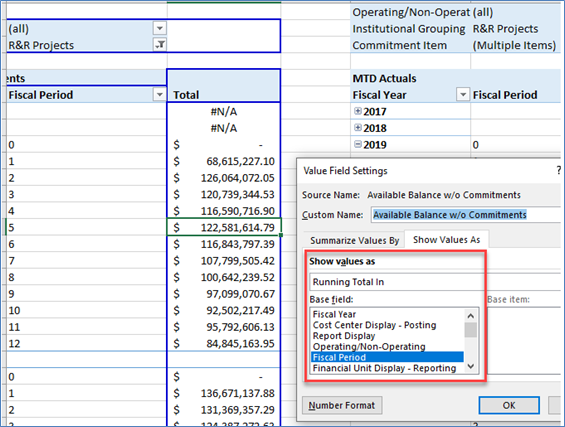
To get the available balance for a period in the middle of a fiscal year, Fiscal Period must be <=, not just =. You cannot just put the periods as columns and use the Available Balance fact to get balance trends. The fact does not work in this manner as it is not a cumulative balance when periods are displayed. However, you may be able to use Excel to create a running total. To do this, use the Value Field Settings and on the Show Values As tab, select Running Total In and select the Fiscal Period.
Data
- There are a limited number of years’ worth of data included in this dataset, i.e. 2017 – present at initial population. Each year a new Fiscal Year begins the oldest Fiscal Year will be dropped.
- The dataset contains enhancement data which are added rows of data that are not contained in SAP. You can identify enhancement data by using the Report Display field. Enhancement values might be FPA Enhancements – Align with Old Trend Report, FPA Enhancements – New Process Internal Grant, FPA Enhancements – New Process Others or FPA Enhancements – FY 19 Temp Fix
- Funded Program attributes are primarily from the Parent Funded Program perspective.
- Transactions may roll up to the Parent for reporting, but the actual transaction can be on a different Fund or Funds Center IN ERROR. Examples would be Work Orders or bad master data set up. Posting fields can help identify these issues.
- Funds Center hierarchy on Enhancement data are only populated down to the Financial Unit level. The lower level fields will be populated with N/A or 0 so there are not null values.
- Historical Cost Centers at a system level are only mapped to the Financial Unit level.
Sharing Files with Others
You can share your spreadsheet with individuals who do not have the software on their machines, but they will be unable to make any changes to the file.
Validation Sources
Any SFA version can be used as a source for validation. Pay close attention to notes on filters in the header of the reports to ensure you are filtering on the same items.
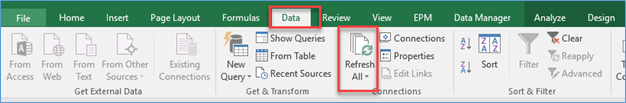
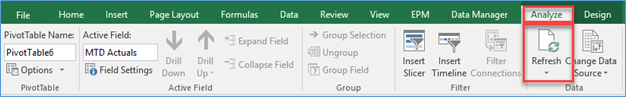
Refreshing your Data
Select the Data menu ribbon (or Analyze menu ribbon), and then click Refresh or Refresh All to refresh all pivot tables. As with regular pivot tables, you can also right click the pivot table and select Refresh Data.
OR
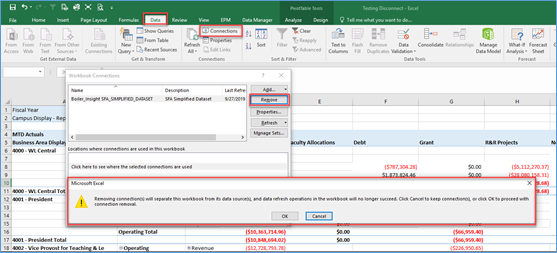
Unhook your file from the Data Source so that it doesn’t update
If you have created a dataset and don’t want the numbers to be updated, you can remove the link to the dataset. Click the Data menu item, then select Connections. Highlight the connection and click Remove. You will get a warning dialog box. Click OK.
Troubleshooting
VPN
You MUST be logged onto VPN. If you are not, you will get the error message shown below.
Error when filtering
- You can have a seemingly endless number of only SINGLE-select filters.
- You can have a seemingly endless number of only MULTI-select filters.
- If you have a SINGLE-select filter, you can have a seemingly limitless number of additional MULTI-select filters.
- However, if you have a MULTI-select filter, you can have NO MORE than two additional SINGLE-select filters.
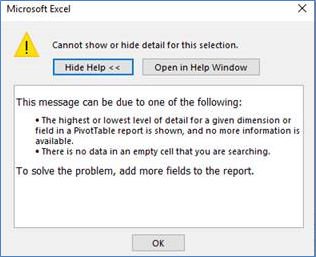
Drill Down Error
Excel throws an error when drilling-down at any level for values that contain a COMMA.
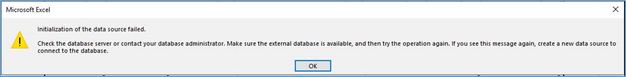
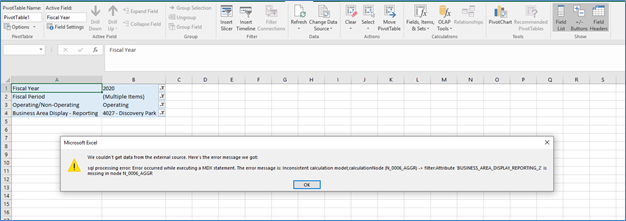
Refresh Error
In some cases, the error shown below is received when trying to refresh data. After the error, click Refresh Data again, and it will work.
Still need help? Click the 'Purdue IT Request' button to start a ticket.